 Ashutosh Nayak
The Power of Data: Why Effective Reporting Matters in ERPNext
ERPNext, at its core, is a powerful system for managing your business operations. From inventory and sales to accounting and human resources, it gathers a vast amount of data. However, the true value of this data is only realized when it can be effectively analyzed and presented. Standard reports in ERPNext are a great starting point, offering pre-built insights into various aspects of your business. But what happens when your needs become more specific, more complex, or simply go beyond what the out-of-the-box reports can provide? This is where mastering advanced reporting techniques in ERPNext becomes crucial for any business aiming for deeper insights and more informed decision-making.
In today's competitive landscape, gut feelings are no longer sufficient. Businesses need to be data-driven. This means not only collecting data but also transforming it into actionable intelligence. For businesses using ERPNext, this translates to leveraging its reporting capabilities to their fullest extent. This blog post will guide you through the nuances of moving beyond standard reports, exploring custom report creation, understanding the underlying data structures, and employing various tools and techniques to extract the most value from your ERPNext data.
Understanding ERPNext's Data Structure: The Foundation of Custom Reporting
Before diving into custom report creation, a fundamental understanding of how ERPNext structures its data is paramount. ERPNext is built on the Frappe framework, which utilizes a relational database (typically MySQL or PostgreSQL). This means data is organized into tables, with relationships defined between them through primary and foreign keys. Each module in ERPNext (e.g., Sales, Stock, Accounting) corresponds to a set of related tables.
Key tables you'll frequently interact with include:
tabDocType: This table stores metadata about all the DocTypes (the building blocks of ERPNext, like Sales Order, Customer, Item, etc.). While not for direct reporting on transactional data, it's essential for understanding the system's structure.tabSales Order,tabSales Invoice,tabPurchase Order,tabPurchase Invoice: These are core transactional tables for sales and purchasing.tabItem: Contains details about your products and services.tabStock Ledger Entry: A crucial table for tracking inventory movements and valuations.tabJournal Entry,tabGL Entry: Essential for financial reporting and accounting analysis.tabUser: Information about your system users.
Understanding the relationships between these tables is key. For instance, a Sales Order is linked to a Customer via the customer field, and each item on the order is linked to the tabSalesOrderItem table, which in turn links back to the tabItem table.
Most ERPNext reports, whether standard or custom, are built using the Report DocType in Frappe. This DocType allows you to define queries and presentation logic. The underlying query is often written in SQL.
Custom Report Builder: Your First Step Beyond Standard Reports
Frappe provides a user-friendly Custom Report Builder within the ERPNext interface, which is the most accessible way to create custom reports without writing raw SQL (initially). This tool allows you to:
- Select a primary DocType: This forms the basis of your report.
- Add columns: You can select fields from the primary DocType and also from linked DocTypes using dot notation (e.g.,
customer.customer_nameto get the customer's name from a Sales Invoice). - Apply filters: Define criteria to narrow down your data (e.g., Sales Orders created in the last month, Invoices with a specific status).
- Group and aggregate: Group data by certain fields (e.g., group sales by customer) and perform aggregations like SUM, AVG, COUNT, MIN, MAX on numerical fields.
- Add charts: Visualize your data with various chart types (bar, line, pie, etc.).
The Custom Report Builder is excellent for many common reporting needs. You can save these reports and access them from the Reports section of ERPNext. It's a powerful tool for analysts and business users who need quick, tailored insights.
However, the Custom Report Builder has limitations. For highly complex queries involving multiple joins, subqueries, or conditional logic that goes beyond simple filtering, you might hit its ceiling. This is where transitioning to SQL reports becomes necessary.
SQL Reports: Unlocking Deeper Insights with Custom Queries
For true flexibility and power, writing custom SQL reports directly within ERPNext is the way to go. This requires a good understanding of SQL and the ERPNext database schema. You can create a new Report DocType and select 'SQL Report' as the report type.
When writing an SQL report, you define the query as a string within the Report DocType. This query selects the data you need from one or more tables.
Example Scenario: Let's say you want a report showing the total value of sales orders created for each customer in the last quarter, along with the total quantity of items ordered by that customer.
SELECT
    T1.customer,
    SUM(T1.total) AS total_order_value,
    SUM(T2.qty) AS total_item_quantity
FROM
    `tabSales Order` AS T1
JOIN
    `tabSales Order Item` AS T2 ON T1.name = T2.parent
WHERE
    T1.docstatus = 1 -- Posted
    AND T1.status != 'Cancelled'
    AND T1.creation >= DATE_SUB(CURDATE(), INTERVAL 3 MONTH)
GROUP BY
    T1.customer
ORDER BY
    total_order_value DESC;
Explanation:
- We select the
customerfield, and use aggregate functionsSUMfortotal_order_valueandtotal_item_quantity. - We join
tabSales Order(aliased as T1) withtabSales Order Item(aliased as T2) using theparentfield, which links the item to its order. - The
WHEREclause filters for posted sales orders (docstatus = 1), excludes cancelled ones, and selects orders created in the last 3 months. GROUP BY T1.customeraggregates the results for each customer.ORDER BYsorts the report by the total order value in descending order.
Tips for SQL Reports:
- Use table aliases: Makes your queries more readable, especially with multiple joins.
- Filter efficiently: Use
WHEREclauses to limit the dataset processed by the database. - Understand
docstatus: 0 = Draft, 1 = Submitted, 2 = Cancelled. Usedocstatus = 1for actual posted transactions. - Leverage
DATE_SUBandCURDATE: For dynamic date filtering. - Test your queries: Use a database client to test complex queries before implementing them in ERPNext.
Advanced Techniques: Python Scripts and Server Scripts for Dynamic Reporting
While SQL is powerful for data retrieval, sometimes reports need more complex logic, data manipulation, or integration with external services. This is where Python comes into play within Frappe.
Python Scripts for Reports:
ERPNext allows you to create 'Python Reports'. Here, you write Python code that can perform complex data processing. The report executioner can then use this processed data to render the output, often using Jinja templating for HTML views.
This approach is beneficial when:
- You need to perform calculations that are difficult or inefficient in SQL.
- You need to fetch data from multiple sources or external APIs.
- You need to apply sophisticated business rules to the data before display.
A Python report typically involves a get_data() method that returns a list of dictionaries, which Frappe then renders. You can also define custom templates for a fully tailored user interface.
Server Scripts:
Server Scripts (Python) can be attached to specific DocTypes or run as standalone scripts. While not directly 'reports' in the same sense, they can be used to trigger data processing and updates that feed into reports, or to generate reports on demand based on specific events.
For instance, a server script could run nightly, aggregate data from various transactions, and store the summarized results in a custom table. This custom table can then be easily queried by a simple SQL or Custom Report Builder report, dramatically improving performance for complex analytical queries.
Visualizing Your Data: Charts and Dashboards
Raw data, even when well-structured, can be hard to interpret quickly. Visualizations are key to making data accessible and actionable. ERPNext's reporting tools offer several ways to visualize data:
- Custom Report Builder Charts: As mentioned, you can add charts directly to custom reports created via the builder.
- Print Formats: While primarily for printing documents, you can embed charts and custom HTML/Jinja logic into print formats.
- Dashboards: Frappe/ERPNext allows the creation of custom dashboards. You can add 'Report Widgets' to these dashboards. These widgets can display charts from your custom reports, providing a consolidated view of key metrics. This is arguably the most effective way to present ongoing business intelligence to stakeholders.
By combining custom reports (SQL or Python) with dashboard widgets, you can create a dynamic and informative business intelligence hub tailored to your specific needs.
Best Practices for ERPNext Reporting
- Understand Your Business Needs First: Before diving into technical details, clearly define what questions you need to answer and what insights you are looking for.
- Start Simple: Leverage the Custom Report Builder first. Only move to SQL or Python when necessary.
- Optimize Queries: Poorly written SQL queries can impact system performance. Always strive for efficiency.
- Secure Your Data: Be mindful of data sensitivity. Grant access to reports based on user roles.
- Document Your Reports: Especially for complex SQL or Python reports, document the logic, source tables, and purpose.
- Iterate and Refine: Reporting is an ongoing process. As your business evolves, so will your reporting needs. Be prepared to revisit and refine your reports.
Conclusion: Empowering Your Business with Tailored Insights
ERPNext is a versatile platform, and its reporting capabilities are no exception. While standard reports offer a good foundation, mastering custom reporting techniques – from the intuitive Custom Report Builder to the powerful SQL and Python scripting options – unlocks a new level of business insight. By understanding the data structure, choosing the right tool for the job, and focusing on clear visualizations, you can transform your ERPNext data from mere information into strategic intelligence. This empowers you and your team to make faster, more informed decisions, ultimately driving business growth and efficiency. Don't let your data remain hidden; uncover its potential with advanced ERPNext reporting.
Related articles
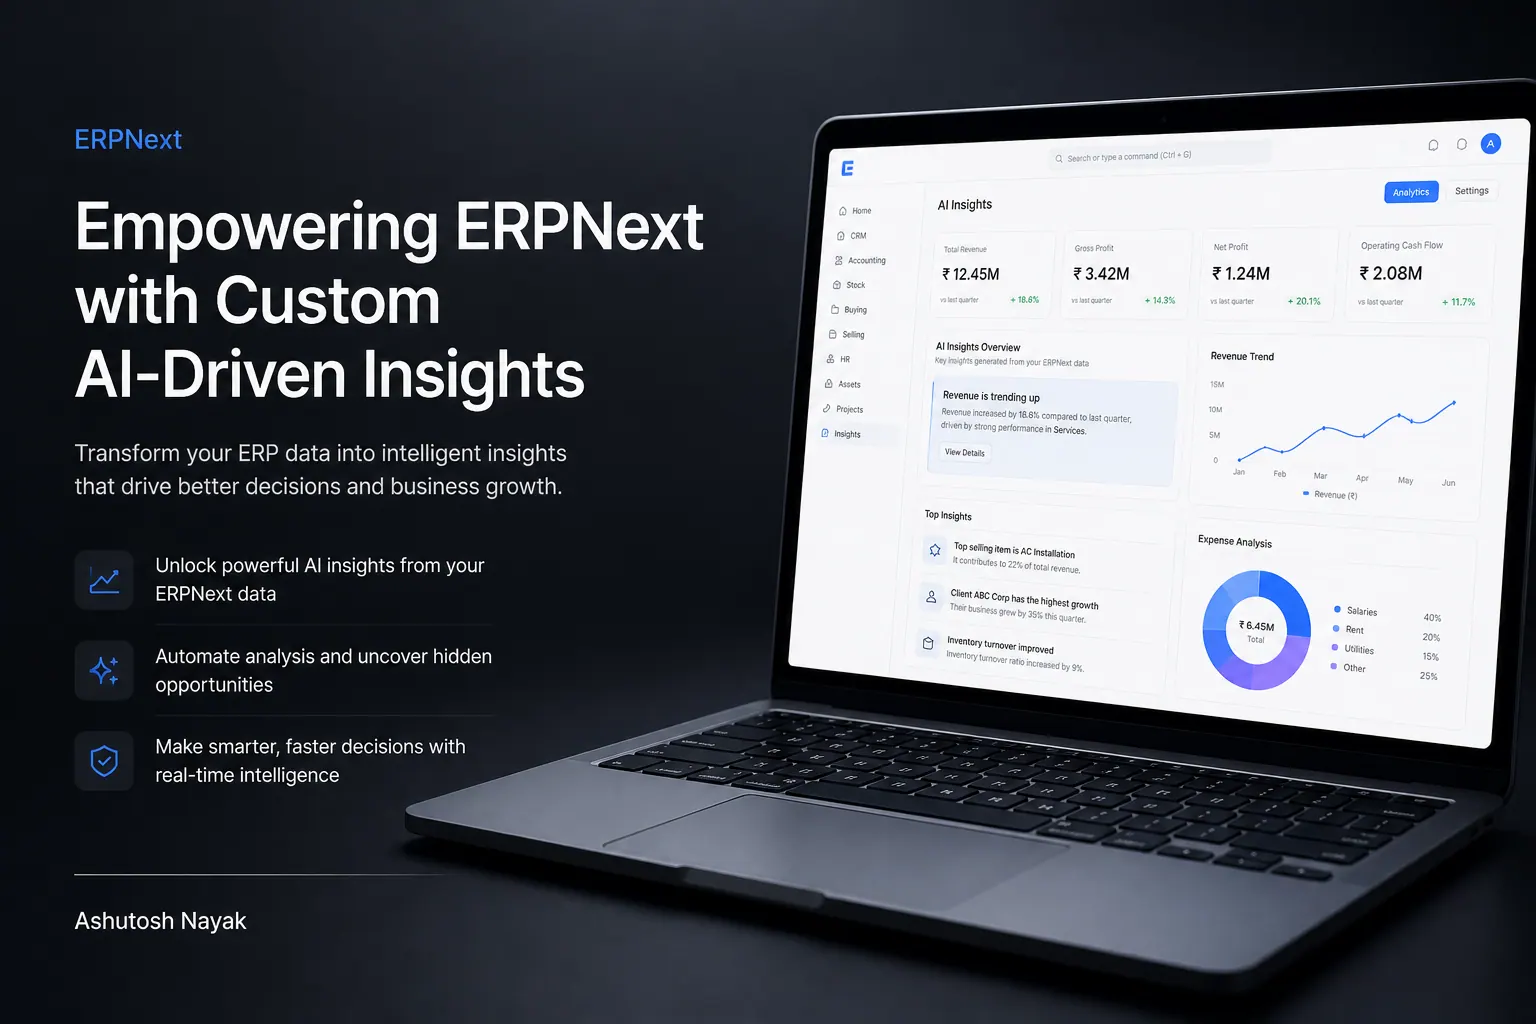
Empowering ERPNext with Custom AI-Driven Insights
Learn how to integrate custom AI models into ERPNext to unlock advanced business insights and automate complex decision-making processes.

Unlocking ERPNext Potential with Custom Python Scripting
Discover how custom Python scripts can extend ERPNext's capabilities, automate workflows, and drive business efficiency beyond standard configurations.

From Data Silos to Strategic Insights: ERPNext & Python Power
Learn how to break down ERPNext data silos using Python and Pandas to unlock actionable business insights and drive strategic decision-making.
Get new articles in your inbox
Occasional writing on AI, ERP and data analytics — no spam, unsubscribe any time.